Peltier Tech is a World Leader in Excel Charting

Charting is a vital part of data analytics. Peltier Tech can help you conquor your charting issues, through software, consulting, and training.

What Peltier Tech Can Do For You

Peltier Tech Charting Software

Starting with the Waterfall Chart Utility in 2008, Peltier Tech has developed comprehensive Excel add-ins that extend Excel’s charting capabilities. These add-ins provide custom chart types that are difficult and tedious to build in Excel, as well as formatting tools that make manipulating your charts quick and easy.

Peltier Tech Consulting

Peltier Tech has worked on many Excel projects for third-party clients that include small and large organizations, in manufacturing, finance, government, and the military.

Projects have included VBA- and template-based projects for building complex business models, commercial add-ins used to monitor and improve manufacturing processes, a market report builder that reduced a customer’s efforts on his monthly reports from two weeks to one day, and an Excel add-in used to apply company styles to tables and charts before exporting them to PowerPoint.

Peltier Tech Training

Peltier Tech has developed training in various Excel topics related to data analytics and visualization. Topics include formulas, charting, Tables and Pivot Tables, Power Query, VBA programming, dashboard reports, and more. Sessions range from one- to two-hour seminars, half- to full-day classes, and multiple-day courses. Venues include conferences, Meetups, association meetings, private company facilities, and even video meetings.

What My Clients Say

"Absolutely game changer, I love it, and it's so helpful."
- Lara K
"Loving the add in – especially the Marimekko charts…!"
- Matt W.
"I love your add-in, thanks so much for creating it."
- Morgan S
"Your utility is a life saver, it probably would have taken me hours to create what your utility has allowed me to do in minutes."
- Billy L
"It took me a about ten minutes to learn and saved me a shed load of time altering data ranges in about 110 excel charts."
- John H
"There are a lot of products out there for waterfalls, but yours still remains the best even after all these years!! Thanks for sharing it."
- Joe B.

Peltier Tech Blog​

Cornerstone Posts

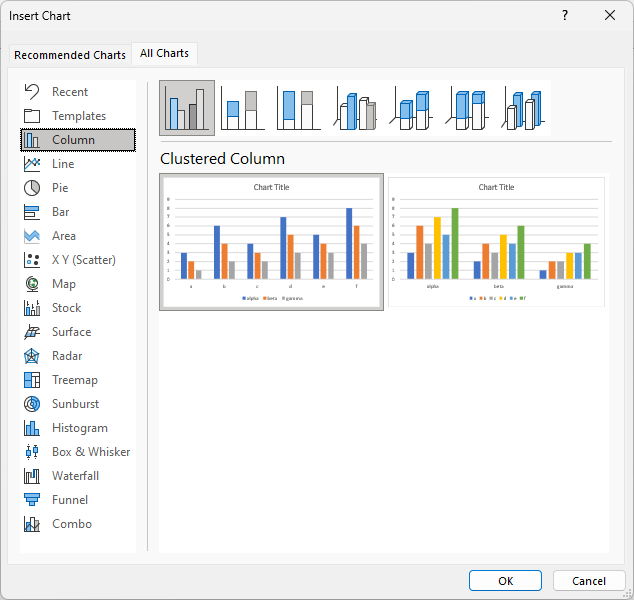
How to Create Excel Charts

This article explores the numerous ways you can create an Excel chart: Insert from the ribbon, Quick Analysis, and keyboard shortcuts...

Recent Posts

Better Pie Chart Data Labels

This tutorial shows how to improve pie chart data labels. First, format with a glow effect to improve contrast. Second, use VBA to position labels between Center and Inside End. Also, you'll read how...

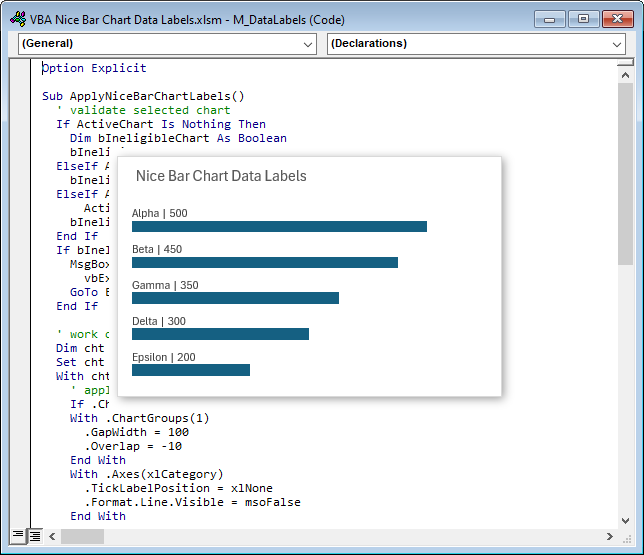
Nice Bar Chart Data Labels Using VBA

Nice Bar Chart Data Labels In Nice Bar Chart Data Labels, I showed how to manually make a bar chart with nice data labels, aligned parallel to the bars, in the space above each bar. These labels...

Meet Jon Peltier Founder Peltier Tech

Jon Peltier is a master of leveraging the power of Excel to produce and simplify complex solutions in engineering, finance, and marketing. 

Jon holds a Doctor of Science degree from MIT in Metallurgy, his background includes Manufacturing, Statistics, Total Quality, and Six Sigma. Jon programs extensively in VBA to improve user productivity and allow faster analysis and display of data, and he knows more about Excel charts than practically anyone. 

Jon has been a full time Excel developer since 2004, and has received Microsoft’s Most Valuable Professional award every year since 2001.